Tools › Environmental › Groundwater › Water Chemistry Diagrams › Method
Water Chemistry Diagrams: Method
Open the Water Chemistry Diagrams tool
Water Chemistry Diagrams: Milliequivalents, Charge Balance, Piper, Stiff and Schoeller
The tool takes the major-ion analyses of water samples (calcium, magnesium, sodium, potassium, bicarbonate, carbonate, sulfate and chloride) and draws the three diagrams hydrogeologists use to compare them: the Piper trilinear diagram, Stiff patterns and the Schoeller chart. Along the way it turns the concentrations into milliequivalents per liter, checks that the positive and negative charges balance, and names each water by its predominant ions.
The idea: compare charges, not weights
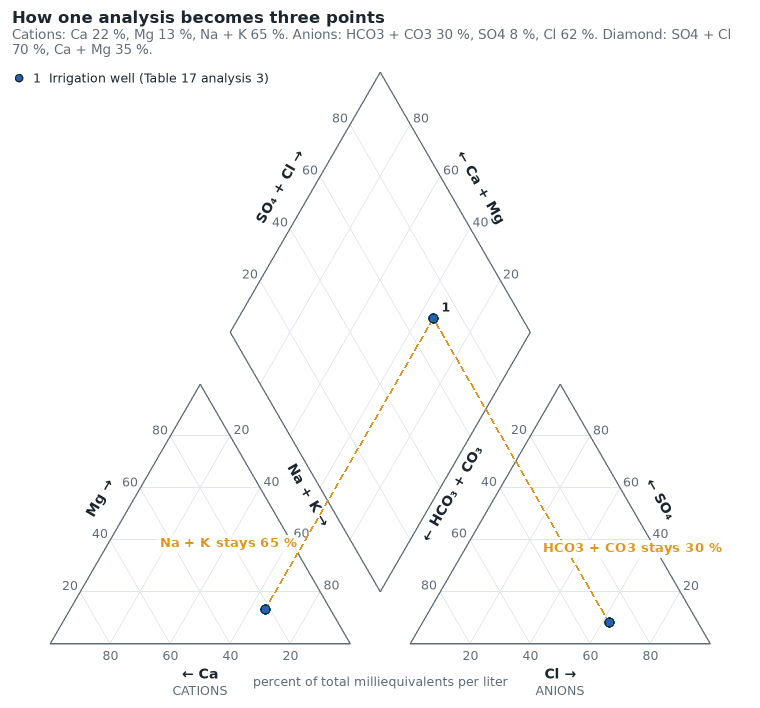
A laboratory reports each ion by weight, in milligrams per liter. Weights do not compare well: a sulfate ion weighs almost three times as much as a chloride ion and carries twice the charge. Dividing each concentration by the weight that carries one unit of charge gives milliequivalents per liter (meq/L), and in that unit a water must balance: the cations together carry as much positive charge as the anions carry negative charge. That one fact gives both a check on the analysis and a natural way to draw it, as percentages of the cation total and of the anion total.
The Piper diagram plots the cation percentages in one triangle and the anion percentages in another, then combines the two points into a third in the diamond between them. Waters of the same type fall together whatever their strength; a mixture of two waters falls on the straight line between them.
Milligrams per liter to milliequivalents per liter
meq/L = mg/L × F, where F is the charge of the ion divided by its formula weight. The factors are those of Table 9 of U.S. Geological Survey Water-Supply Paper 2254 (page 56, based on the 1975 atomic weights); the last column is 1 ÷ F, the weight in milligrams that carries one milliequivalent.
| Ion | Formula | Charge | F, meq/L per mg/L | 1 ÷ F, mg per meq |
|---|---|---|---|---|
| Calcium | Ca | +2 | 0.04990 | 20.04 |
| Magnesium | Mg | +2 | 0.08229 | 12.15 |
| Sodium | Na | +1 | 0.04350 | 22.99 |
| Potassium | K | +1 | 0.02558 | 39.09 |
| Bicarbonate | HCO3 | −1 | 0.01639 | 61.01 |
| Carbonate | CO3 | −2 | 0.03333 | 30.00 |
| Sulfate | SO4 | −2 | 0.02082 | 48.03 |
| Chloride | Cl | −1 | 0.02821 | 35.45 |
| Nitrate | NO3 | −1 | 0.01613 | 62.00 |
Enter nitrate as NO3. A laboratory that reports "nitrate as nitrogen" or "alkalinity as CaCO3" is using another basis, and those values must be converted before they are pasted.
The equations
| Quantity | Formula | Note |
|---|---|---|
| Sum of cations | Σc = Ca + Mg + Na + K | each in meq/L |
| Sum of anions | Σa = HCO3 + CO3 + SO4 + Cl + NO3 | each in meq/L; nitrate when it is given |
| Charge-balance error | 100 (Σc − Σa) ÷ (Σc + Σa) | percent; positive when cations are in excess |
| Cation triangle | Ca ÷ Σc, Mg ÷ Σc, (Na + K) ÷ Σc | three percentages that add to 100 |
| Anion triangle | (HCO3 + CO3) ÷ Σa, SO4 ÷ Σa, (Cl + NO3) ÷ Σa | the paper lumps nitrate and fluoride with chloride |
| Diamond, upper left scale | SO4 + Cl percent of the anions | 100 minus the bicarbonate plus carbonate percentage |
| Diamond, upper right scale | Ca + Mg percent of the cations | 100 minus the sodium plus potassium percentage |
The Piper projection, written out
Draw both triangles with sides of length 1 on one base line, a gap g apart, and measure x to the right and y upward from the calcium corner. With h = √3 ÷ 2 and the shares as fractions (M magnesium, N sodium plus potassium, S sulfate, C chloride):
- cation point: x = N + M ÷ 2, y = h M (calcium corner at the left, sodium plus potassium at the right, magnesium at the top);
- anion point: x = 1 + g + C + S ÷ 2, y = h S (bicarbonate plus carbonate at the left, chloride at the right, sulfate at the top);
- from the cation point go up and to the right, parallel to the calcium-magnesium side: every point of that line has the same N;
- from the anion point go up and to the left, parallel to the chloride-sulfate side: every point of that line has the same bicarbonate plus carbonate share;
- the lines cross at x = (1 + g) ÷ 2 + (N + A) ÷ 2, y = h (1 + g + A − N), where A = S + C.
So the diamond is a plot of A (sulfate plus chloride) against N (sodium plus potassium) on skewed axes: its left corner is a calcium-magnesium bicarbonate water, its top corner a calcium-magnesium sulfate or chloride water, its right corner a sodium chloride or sulfate water, and its bottom corner a sodium bicarbonate water. The tool draws with g = 0.2. The test of the tool checks, for every sample, that the diamond point lies on both projection lines.
Stiff patterns and the Schoeller chart
A Stiff pattern puts the cations to the left of a vertical axis and the anions to the right, on three horizontal lines: sodium plus potassium against chloride, calcium against bicarbonate plus carbonate, magnesium against sulfate, each in meq/L. Joining the six points gives a polygon whose shape shows the type of the water and whose width shows its strength. All patterns of one figure are drawn at one scale so that they can be compared. (Figure 32 of the paper has a fourth line, iron against carbonate; here carbonate is added to bicarbonate and iron is not plotted.)
The Schoeller chart plots the same six quantities on a logarithmic scale and joins them by a line for each sample. Because the scale is logarithmic, diluting a water moves its line down without changing its shape, so a brine and a dilute spring can share one chart.
Naming the water
The paper (page 166) names a water by its predominant cation and anion in meq/L, and says that a water in which no one cation or anion reaches 50 percent of its total is a mixed type, to be named by all its important ions. The tool follows that rule; what counts as "important" in a mixed type is the choice of this page (20 percent of the total, an input in Advanced mode).
What it assumes
- The eight major ions (and nitrate, when given) carry essentially all the charge. That is so for most natural fresh water.
- Each ion is in the form and charge of the table: bicarbonate as HCO3−, sulfate as SO42−, and so on.
- A blank cell is a concentration of zero.
- For the straight mixing line: the two waters mix without reacting (nothing precipitates, dissolves or exchanges with the rock).
When it misleads
- The Piper diagram shows proportions only. A rain water and a brine with the same proportions plot at the same point; look at the Stiff widths, the Schoeller chart or the table for the concentrations.
- Sodium and potassium share a corner, and so do bicarbonate and carbonate, and chloride and nitrate. Waters that differ only inside those pairs cannot be told apart on the diagram.
- Acid waters, strongly colored waters and brines carry charge on ions that are not in the list (hydrogen, iron, aluminum, organic anions, bromide, strontium). The balance then seems off, or balances by accident. The paper notes that for water much above 1,000 mg/L the balance says little about the lesser constituents.
- A good charge balance does not prove an analysis right: sodium calculated by difference, as in many analyses made before about 1960, balances exactly by construction.
- A point on the line between two waters is consistent with a mixture of them; it is not proof of one.
Common mistakes
- Taking percentages of mg/L instead of meq/L. The triangles are always in milliequivalents.
- Pasting alkalinity "as CaCO3" in the bicarbonate column. When all the alkalinity is bicarbonate, bicarbonate in mg/L is about 1.22 times the alkalinity as CaCO3 (61.01 mg per meq of bicarbonate against 50 mg per meq of CaCO3).
- Pasting nitrate "as N" in the nitrate column. Nitrate in mg/L is about 4.43 times nitrate-nitrogen (62.00 ÷ 14.01; the atomic weight of nitrogen is the standard value, not a figure of the cited table).
- Reading the diamond scales the wrong way round: sulfate plus chloride grows toward the top along the left side, calcium plus magnesium toward the top along the right side.
- Drawing Stiff patterns at different scales and then comparing their widths.
- Leaving a sample off the plot because it does not balance, without finding out why. A decimal slip in one ion is a common reason, and the third example of the tool shows what it looks like.