Tools › Civil and Geotechnical › Transportation › Traffic Signal Warrants › Method
Traffic Signal Warrants: Method
Open the Traffic Signal Warrants tool
Traffic Signal Warrants: What Hourly Counts Give Under Warrants 1, 2 and 3
The tool takes an intersection's hourly counts (the major street's two approaches together, and one minor-street approach) and the number of lanes, and reports what those volumes give under the three volume warrants of the federal Manual on Uniform Traffic Control Devices (MUTCD), 11th Edition with Revision 1, dated December 2025. It draws every hour on the manual's warrant curve. It states what the counts give; it does not judge whether to install a signal.
What a warrant is, and is not
A warrant is a threshold condition. The manual lists nine of them and requires an engineering study of traffic conditions, pedestrian characteristics and the physical layout before a signal is installed (Section 4C.01, paragraph 01). The study includes the warrants; it is not replaced by them. The manual says so in a Standard (Section 4C.01, paragraph 03):
The satisfaction of a traffic signal warrant or warrants shall not in itself require the installation of a traffic control signal.
and in a Support statement (paragraph 20): The satisfaction of a warrant (or warrants) is one of the relevant factors in the engineering study, but it is not intended to be the only factor or even the overriding consideration.
The idea in one figure
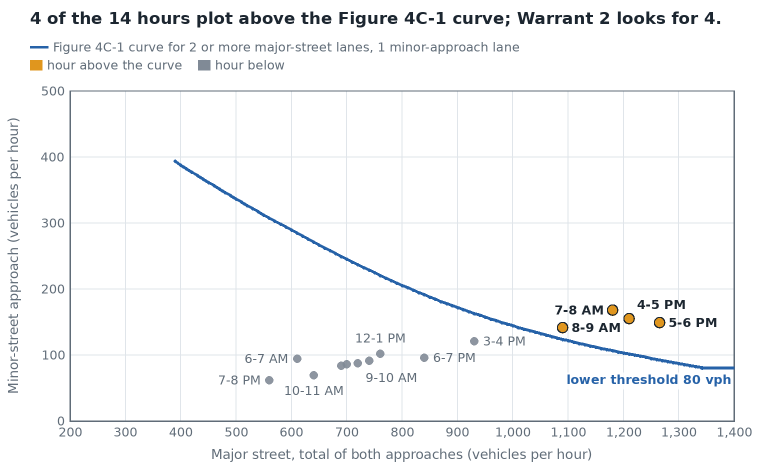
Each hour of the day is one point: major-street volume across, minor-approach volume up. Warrants 2 and 3 are curves on that plane; an hour above the curve counts. Warrant 1 is a pair of rectangles (a major-street volume and a minor-approach volume that both have to be reached).
Warrant 1, Eight-Hour Vehicular Volume (Section 4C.02, Table 4C-1)
For each of any 8 hours of an average day, both volumes of Condition A, or both volumes of Condition B, exist on the major street (total of both approaches) and on the more critical minor-street approach (one direction only). The 8 hours of A need not be the 8 hours of B. Vehicles per hour, 100 percent columns:
| lanes, major / minor | A major | A minor | B major | B minor |
|---|---|---|---|---|
| 1 / 1 | 500 | 150 | 750 | 75 |
| 2 or more / 1 | 600 | 150 | 900 | 75 |
| 2 or more / 2 or more | 600 | 200 | 900 | 100 |
| 1 / 2 or more | 500 | 200 | 750 | 100 |
The table also prints 80, 70 and 56 percent columns (for the first row: A 400 / 120, 350 / 105, 280 / 84; B 600 / 60, 525 / 53, 420 / 42). Condition A (minimum vehicular volume) is for a large volume of intersecting traffic; Condition B (interruption of continuous traffic) is for a major street so heavy that the minor street cannot enter or cross. The combination looks for 8 hours at the 80 percent column of A and 8 hours at the 80 percent column of B (not necessarily the same hours); the manual's guidance reserves it for locations where other alternatives have had an adequate trial and failed (paragraph 08). The manual treats the three as one warrant: if A is met, B and the combination need no analysis.
Warrant 2, Four-Hour Vehicular Volume (Section 4C.03, Figures 4C-1 and 4C-2)
For each of any 4 hours of an average day, the plotted point falls above the applicable curve of Figure 4C-1. The figure has three curves: 1 lane and 1 lane (lowest); 2 or more lanes and 2 or more lanes (highest); and a middle curve that serves both mixed cases. Each curve flattens into a lower threshold volume printed in the note under the figure: 80 vph for a minor-street approach with one lane and 115 vph with two or more.
Warrant 3, Peak Hour (Section 4C.04, Figures 4C-3 and 4C-4)
Either of two items. Item B: for 1 hour (any four consecutive 15-minute periods), the plotted point falls above the applicable curve of Figure 4C-3 (lower thresholds 100 vph and 150 vph). Item A: in the same hour, all three: stopped-time delay on one STOP-controlled minor approach of at least 4 vehicle-hours (one-lane approach) or 5 (two-lane); at least 100 vph on that approach (one moving lane) or 150 (two); and a total entering volume of at least 650 vph (three approaches) or 800 (four or more). The delay is measured in the field; the tool takes it as an input. The manual's guidance limits this warrant to unusual cases such as office complexes, manufacturing plants, industrial complexes or high-occupancy vehicle facilities.
The 70 percent option
If the posted or statutory speed limit or the 85th-percentile speed on the major street exceeds 40 mph, or the intersection lies within the built-up area of an isolated community with a population under 10,000, the manual allows the 70 percent columns of Table 4C-1 (56 percent for the combination), Figure 4C-2 in place of 4C-1 and Figure 4C-4 in place of 4C-3 (lower thresholds 60 / 80 and 75 / 100 vph). It does not apply to Item A of Warrant 3.
How the curves were read
The manual gives the curves of Warrants 2 and 3 only as printed figures. In the FHWA file they are vector drawings, so the tool's curve tables were taken from the drawing itself, not from a picture of it: the control points of each curve were read from the file, converted to vehicles per hour between the figure's own grid lines, and tabulated every 10 vph of major-street volume (straight lines between). Three checks, with their results:
- a separate pixel reading of the rendered page at 206 places agrees with the tables within 3.4 vph;
- the flat ends of the drawn curves read 80.9 and 114.8 (printed: 80 and 115), 57.5 and 77.7 (60 and 80), 99.8 and 150.4 (100 and 150), 74.7 and 100.0 (75 and 100): the drawing itself is true to its printed numbers within 2.5 vph. The tool uses the printed numbers for the thresholds;
- the 70 percent figures agree with the 100 percent figures shrunk to 70 percent on both axes within 9 vph (the manual's two drawings are not exact copies of each other; the tool uses each figure as drawn).
The printed lines are 6.5 to 7.8 vph thick. So an hour within 6 vph of a curve is flagged with a question mark and the page gives the count both ways.
What it assumes
- The counts are those of an average day, the hours do not overlap, and both volumes of a row are for the same hour.
- The minor volume entered is that of the more critical approach for that hour, after whatever right-turn reduction the study settles on (Section 4C.01, paragraphs 08 to 11).
- "Above the curve" is read as at or above; the lower threshold continues past the right end of the printed axis; an hour whose major-street volume is to the left of where a curve starts is not counted, because the figure gives no value there.
When it misleads
- When a warrant is read as a decision. A met warrant is one factor of the study; an unmet one does not forbid a signal either (the manual lets an agency install one where no warrant is met, after a study that documents why).
- When an hour sits on the curve. The figure cannot settle it; neither can the tool.
- When the lane count is a judgment (a through lane plus a turn lane) and the other choice changes the row of the table.
- When the counts are projections, a single unusual day, or include right turns that enter with little conflict.
- When a State manual or supplement differs from the federal text.
Common mistakes
- Adding both minor-street approaches together. The warrants use one approach, one direction.
- Using only one direction of the major street. The warrants use the total of both approaches.
- Counting an hour for Condition A because the major-street volume is high enough while the minor-approach volume is not: both have to be reached in the same hour.
- Mixing conditions: 5 hours of A and 3 hours of B are not 8 hours of anything.
- Using the 70 percent figures because the speed limit is 40 mph. The text says exceeds 40 mph.
- Forgetting the lower threshold: on a very busy major street the curve does not keep falling.
- Using overlapping hours (7:00 to 8:00 and 7:30 to 8:30) as two hours.
What changed from the 2009 edition
Both texts were read for this page (2009 edition with Revisions 1 to 3, pages 438 to 443). The numbers of Table 4C-1, the lower thresholds and the peak-hour delay values are the same. Differences that matter here: the sentences that say when the need for a signal is considered were Standards (shall be considered
) in 2009 and are Guidance in the 11th Edition; the 2009 text spoke of the higher-volume minor-street approach
where the 11th Edition says more critical minor-street approach
; and the 2009 figures labeled the middle curve only 2 OR MORE LANES & 1 LANE
, where the 11th Edition labels both mixed cases and shows which lower threshold each takes. Revision 1 (December 2025) changed one thing in these sections: the heading Condition B—Interruption of Continuous Traffic
was restored above the second half of Table 4C-1. Whether the curves themselves were redrawn between editions was not checked.
Not covered
Warrants 4 to 9 (pedestrian volume, school crossing, coordinated signal system, crash experience, roadway network, intersection near a grade crossing), the options of Section 4C.01 for wide medians and heavy major-street left turns, alternatives to signals, and the engineering study itself.