Tools › Civil and Geotechnical › Soils › Proctor Compaction Curve › Method
Proctor Compaction Curve: Method
Open the Proctor Compaction Curve tool
Proctor Compaction Curve: Maximum Dry Density and Optimum Water Content
The tool turns the readings of a laboratory compaction test into the dry density of each specimen, draws a curve through the points and reports its peak: the maximum dry density and the optimum water content. It adds the zero-air-voids and saturation lines, flags a point no soil can reach, and compares field density tests with the maximum.
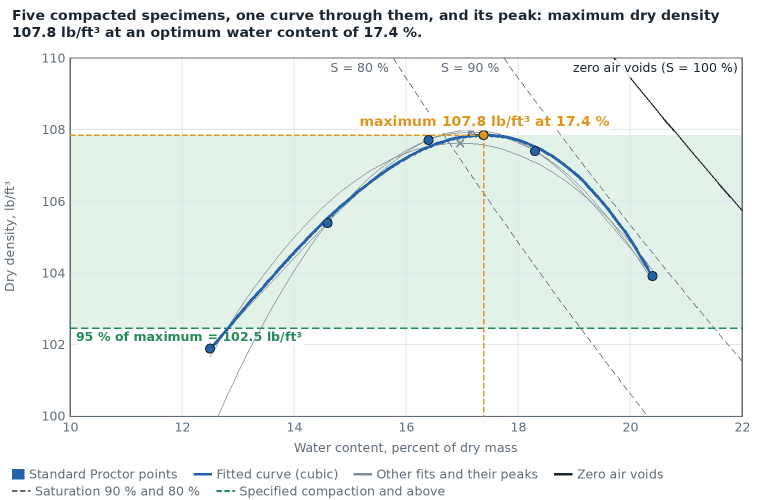
The idea: a soil packs tightest at one water content
Compact the same soil with the same effort at several water contents and weigh what fits in the mold. A dry soil is stiff and leaves air between the lumps; a little water lets the grains slide together and the density rises; beyond a certain water content the water itself takes up room the grains could have had, and the density falls again. R. R. Proctor described this in 1933. The top of the hump is the densest state that compactive effort can reach, and field work is specified as a percentage of it.
The two usual tests
| Test | Rammer | Drop | Layers | Blows per layer | Mold volume | Energy |
|---|---|---|---|---|---|---|
| Standard Proctor (ASTM D698, AASHTO T 99) | 5.5 lb | 12 in | 3 | 25 | 1/30 ft³ | 12,375 ft-lbf/ft³ |
| Modified Proctor (ASTM D1557, AASHTO T 180) | 10 lb | 18 in | 5 | 25 | 1/30 ft³ | 56,250 ft-lbf/ft³ |
| USBR 5500 | 5.5 lbm | 18 in | 3 | 25 | 1/20 ft³ | 12,375 ft-lbf/ft³ |
The test chosen on the form names the results and fills the usual mold volume. The arithmetic is the same for all of them. The modified test puts in 4.5 times the energy of the standard test, so its peak is higher and at a lower water content.
Dry density of a point
wet soil mass = (mass of mold + wet soil) − (mass of mold)
ρwet = wet soil mass / mold volume
w = (can + wet soil − can + dry soil) / (can + dry soil − can) × 100 (percent of the dry mass)
ρd = ρwet / (1 + w / 100)
Dry density is the mass of the solids alone in the volume the wet soil filled. The page works the densest point in full and tabulates the rest.
The mold and the mold with soil are entered in pounds in U.S. units and in grams in SI (kilograms can be chosen from the unit list); the unit switch converts them both ways, and 1 g/cm³ is 1,000 kg/m³. The three moisture-can weights are plain numbers in any one unit, usually grams even on a sheet kept in pounds, because only their ratio is used.
The curve and its peak: a choice, stated
The test procedures say to plot dry density against water content, connect the points with a smooth curve and read the peak. None of those read for this page names an equation; one of them says of its own example that the values "are approximate since they are based on sketching the curve to fit the points." So the maximum dry density is a property of the curve drawn, not a measurement: usually no specimen was compacted at the peak. The tool offers four curves and always lists the peak of all four.
- Least-squares cubic (the default): ρd = c0 + c1 t + c2 t² + c3 t³ with t = w − w0 (w0 is the mean water content), the coefficients chosen so that the sum of the squared distances of the points from the curve is smallest. A cubic can lean to one side, as measured curves often do. The peak is where the slope c1 + 2 c2 t + 3 c3 t² is zero and the curve bends downward: t = (−c2 − √(c2² − 3 c1 c3)) / (3 c3). It needs four points and passes exactly through them when there are only four.
- Least-squares parabola: the same without the cubic term; peak at t = −c1 / (2 c2). Symmetric, and the steadiest when the points scatter.
- Parabola through the three highest points: ignores the other points. Close to what a person does when sketching the top of the curve.
- Smooth curve through every point: a natural cubic spline, which passes through each point and bends as little as possible in between. It treats every reading as exact.
The least-squares curves pass near the points and smooth out weighing errors; the other two pass through points and follow them. On the printed example of USBR 5500-89 (five specimens; the manual's hand-drawn curve peaks at 114.0 lbf/ft³ and 14.0 %) the four fits give 113.3 to 114.1 lbf/ft³ at 14.3 to 14.5 %. The spread among the fits is printed with every result; it is the least uncertainty of the reported maximum.
A peak is reported only when the curve has a maximum inside the tested water contents. If the densest point is the wettest or the driest one tested, the page says that the points do not bracket a peak and reports none.
Zero air voids and saturation
With specific gravity of the solids Gs, water density ρw, and w and the degree of saturation S as decimals:
ρd = Gs ρw / (1 + w Gs / S) (S = 1: the zero-air-voids line)
S = w Gs / e, with the void ratio e = Gs ρw / ρd − 1
At zero air voids every void is full of water. A compacted soil always keeps some air, so compaction curves approach that line on the wet side and never cross it. A point beyond it (saturation above 100 %) is an error in a reading or in the specific gravity, and the page marks it in red. The lines of 90 % and 80 % saturation show how full of water the voids are along the curve.
Field tests and specified compaction
relative compaction = field dry density / maximum dry density × 100
A field density test gives the wet density and the water content of the fill in place; its dry density follows as above. The page lists the relative compaction of each test, how far its water content is from the optimum, and whether it is at or above, or below, the percentage entered. It states the comparison; whether a fill is accepted is for the specification and the engineer responsible.
Oversize particles
The test is run on the soil passing a sieve (No. 4 for the 4 in mold). When the fill also contains larger particles, the laboratory maximum is adjusted before field tests on the whole soil are compared with it. With P the oversize share of the dry mass as a decimal and Gm the bulk specific gravity of the oversize particles:
Earth Manual, eq. 1-15: ρt = 1 / (P / (Gm ρw) + (1 − P) / ρd,max)
NAVFAC DM-7.02: ρmax = (1 − 0.05 P) / (P / (Gm ρw) + (1 − P) / ρd,max), with Gm ρw = 162 lb/ft³ for Gm = 2.60
adjusted optimum water content = P woversize + (1 − P) wopt
The first assumes every oversize particle is surrounded by finer soil at its laboratory maximum; the Earth Manual notes that above about 30 % oversize the field density falls short of it. The second lowers the result by 5 % of the oversize fraction and is described as suitable below 60 % oversize in well-graded materials.
What it assumes
- Every point is the same soil compacted with the same effort; only the water content differs.
- The readings are right. The tool does not see the layers, the blows, the trimming or how the water content sample was taken.
- One specific gravity holds for all the solids. It moves the saturation lines only; the dry densities and the peak do not depend on it.
- The curve between the points is smooth. Nothing was measured there.
- Field tests are compared with the one curve entered, so the fill must be the same soil as the laboratory sample.
When it misleads
- With too few points near the top. Two points bracketing the peak four points of water content apart leave the peak open by more than any fit shows.
- With clean sands and gravels. The manuals note that free-draining soils give erratic compaction curves, often without a definable maximum; relative density tests are used for them instead.
- When the soil in the field is not the soil in the mold. A change of borrow material changes the maximum; a field test at 93 % of the wrong curve says nothing.
- When a field test is close to the specified value. The fits alone move the maximum by a few tenths of a pound per cubic foot, and repeat tests differ by more: USBR 5500-89 gives, for two results by one operator, a limiting difference of 1.9 % of the maximum dry unit weight and 9.5 % of the optimum moisture content (percent of their mean), and between laboratories a standard deviation of 1.66 lbf/ft³ and 0.86 points of moisture content.
- Outside the tested water contents. The fitted curve has no meaning there, and the page draws it only between the driest and the wettest point.
Common mistakes
- Dividing by (1 + w) with w in percent: 16.4 % is 0.164, so ρd = ρwet / 1.164, not ρwet / 17.4.
- Taking the water content as water over wet mass. It is water over dry mass.
- Forgetting to subtract the mold, or weighing the mold with the collar on.
- Reporting the highest point as the maximum. The peak usually lies between two points.
- Using the nominal mold volume when the measured one differs: a 1 % error in volume is a 1 % error in every density.
- Mixing unit weight and density with a wrong water value: 62.4 lb/ft³ goes with pounds, 1,000 kg/m³ with kilograms, 9.81 kN/m³ with kilonewtons.
- Comparing a field test with a standard curve when the specification names the modified test (or the reverse): 95 % of modified can be more than 100 % of standard.
- Drawing the zero-air-voids line with a guessed specific gravity and then reading a point beyond it as a soil property.