Tools › Finance and Business › Tax › Marginal Tax Rate Map › Method
Marginal Tax Rate Map: Method
Open the Marginal Tax Rate Map tool
Marginal Tax Rate Map: What the Next Dollar Really Costs
The tool takes a household's filing status, ages, Social Security benefits and other income, figures its federal income tax, and maps the tax rate on the next dollar of one kind of income across a range, beside the plain bracket rate. Where the two lines part, it names the rule that causes the gap. It is arithmetic on the numbers entered: an illustration, not tax advice.
The idea: figure the whole tax twice
A tax bracket says how the rate schedule treats one more dollar of taxable income. But one more dollar of income can move taxable income by more than a dollar: it can make more of the Social Security benefits taxable, shrink a deduction that phases out, or push long-term gains out of the 0 % rate. The honest way to count all of that is not a formula for each interaction but one function that computes the whole tax, used twice:
rate on the next step = (tax at income + step − tax at income) ÷ step
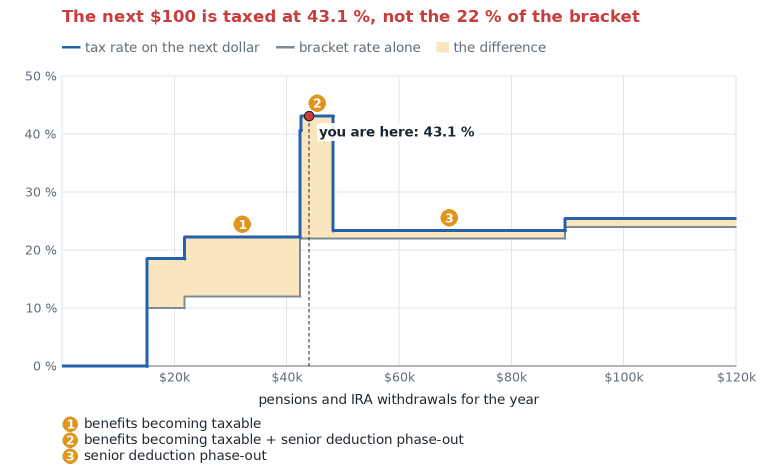
Every rule in the function then shows up in the rate exactly where it bites, and two rules that bite together add up as they do on a return. The tax is a chain of straight-line pieces, so the map is a staircase: the tool finds every income at which the slope changes and lists the segments between them.
The pieces of the tax function
A rule is in the function only if it was read in the statute or an IRS document and has its own test. In the order the return applies them:
| Piece | Rule | Read from |
|---|---|---|
| Taxable Social Security benefits | Take half the benefits plus all other income and tax-exempt interest. Nothing is taxable up to the base amount ($25,000; $32,000 joint). Each dollar in the next $9,000 ($12,000 joint) makes 50 cents of benefits taxable; each dollar above that, 85 cents; never more than 85 % of the benefits. | Publication 915, Worksheet 1, lines 1 to 19 |
| Adjusted gross income | Wages + pensions and IRA withdrawals + interest + dividends and gains + taxable benefits. | Form 1040 |
| Standard deduction | The basic amount plus an additional amount for each person aged 65 or over or blind; or the itemized deductions if larger. | Rev. Proc. 2025-32, section 4.14 |
| Deduction for seniors (2025 to 2028) | $6,000 for each person aged 65 or over, each reduced by 6 % of the income over $75,000 ($150,000 joint). It is taken with either the standard or the itemized deduction. | Public Law 119-21, section 70103; Schedule 1-A, Part V |
| Tax on ordinary income | The rate schedule of the filing status on taxable income less the dividends and gains. | Rev. Proc. 2025-32, section 4.01 |
| Tax on qualified dividends and long-term gains | They sit on top of the ordinary income: the part under the 0 % amount is taxed at 0 %, the part up to the 15 % amount at 15 %, the rest at 20 %. | Qualified Dividends and Capital Gain Tax Worksheet, lines 1 to 25; Rev. Proc. 2025-32, section 4.03 |
| Net investment income tax | 3.8 % of the smaller of investment income and the income over $200,000 ($250,000 joint). | Form 8960, lines 12 to 17 |
| State and local tax cap (Advanced) | Deductible up to $40,400 in 2026, less 30 % of the income over $505,000, but not under $10,000. | Public Law 119-21, section 70120; State and Local Tax Deduction Worksheet |
| Limit on itemized deductions (Advanced) | From 2026, itemized deductions are reduced by 2/37 of the smaller of the deductions and the amount by which taxable income before them passes the start of the 37 % bracket. | Public Law 119-21, section 70111 (statute text only: the IRS worksheet had not been issued) |
Where the humps come from
| Cause | What one more dollar does | Rate on that dollar |
|---|---|---|
| Benefits becoming taxable | adds $1.85 to taxable income (the dollar and 85 cents of benefits) | bracket rate × 1.85: 22.2 % in the 12 % bracket, 40.7 % in the 22 % bracket |
| Deduction for seniors phasing out | removes 6 cents of deduction per person aged 65 or over | bracket rate × 1.06 (one person) or × 1.12 (two) |
| Both at once | adds $1.85, and 6 % of that $1.85 again | 22 % × 1.85 × 1.06 = 43.1 % |
| Gains pushed out of the 0 % rate | is taxed at the bracket rate and moves one dollar of gains from 0 % to 15 % | bracket rate + 15 points: 27 % in the 12 % bracket |
| Net investment income tax | of investment income is taxed 3.8 % more; a dollar of other income can also bring a dollar of investment income over the threshold | bracket rate + 3.8 points |
| State and local tax cap phasing down | removes 30 cents of deduction | bracket rate × 1.30: 45.5 % in the 35 % bracket |
A hump ends when its cause is used up: once 85 % of the benefits are taxable, once the deduction for seniors is gone ($175,000 of income for a single person, $250,000 on a joint return), once all the gains have left the 0 % rate. That is why the rate can fall as income rises.
The 2026 figures in the form, and where each was read
| Figure | Single | Married, joint | Head of household | Read from (2026-11-21) |
|---|---|---|---|---|
| Standard deduction | $16,100 | $32,200 | $24,150 | Rev. Proc. 2025-32, section 4.14(1) |
| Additional amount, age 65 or blind | $2,050 | $1,650 | $2,050 | Rev. Proc. 2025-32, section 4.14(3) |
| 0 % rate on gains up to taxable income of | $49,450 | $98,900 | $66,200 | Rev. Proc. 2025-32, section 4.03 |
| 15 % rate on gains up to | $545,500 | $613,700 | $579,600 | Rev. Proc. 2025-32, section 4.03 |
| Benefits: base amount and 50 % band | $25,000; $9,000 | $32,000; $12,000 | $25,000; $9,000 | Publication 915 (2026), Worksheet 1, lines 9 and 11 |
| Deduction for seniors: threshold | $75,000 | $150,000 | $75,000 | Public Law 119-21, section 70103 |
| Net investment income tax threshold | $200,000 | $250,000 | $200,000 | Instructions for Form 8960, line 14 |
| Rate schedule | 10, 12, 22, 24, 32, 35 and 37 % at the amounts of Tables 1 to 3 | Rev. Proc. 2025-32, section 4.01 | ||
What it assumes
A calendar-year individual return for a U.S. citizen or resident, filing as single, married filing jointly or head of household. All ordinary income is taxed alike; wages carry no payroll tax here. Dividends and gains are qualified dividends and net long-term gains of zero or more. There are no adjustments to income, so adjusted gross income and modified adjusted gross income are the same number. The larger of the standard and the itemized deduction is taken. The tax comes from the rate schedule to the cent. Everything except the varied income stays fixed along the chart.
When it misleads
When the return has something the function does not: a credit that phases out, the alternative minimum tax, a qualified business income deduction, self-employment income, a capital loss, a premium tax credit. Each of those would add its own hump or dip, and the page lists them under "Not included". When more income also raises a Medicare premium two years later, or a state tax: neither is federal income tax, and neither is on the map. When the yearly figures change: the defaults are those of tax year 2026, and the deduction for seniors ends after 2028 unless the law changes. When two kinds of income rise together: the map moves one kind at a time.
Common mistakes
- Reading the bracket as the rate on the next dollar. The bracket is the rate on one more dollar of taxable income; one more dollar of income can add more than a dollar of taxable income.
- Confusing the marginal rate with the average rate. A household can pay 7 % of its income in tax and 43 % on its next dollar.
- Thinking a higher rate applies to all the income. Each rate applies only to the dollars in its own segment.
- Using half of all benefits as the taxable part. The taxable part comes from the worksheet and moves with other income, from none to 85 %.
- Forgetting tax-exempt interest. It is not taxed, but it counts in the income that makes benefits taxable.
- Taxing long-term gains at the bracket rate, or always at 15 %. Gains sit on top of ordinary income; the part under the 0 % amount is untaxed, and ordinary income can push it out.
- Counting the deduction for seniors once for a couple. It is $6,000 for each spouse aged 65 or over, and each is reduced, so a couple loses 12 cents of deduction per dollar in the phase-out.
- Assuming the rate only rises with income. When a phase-in or phase-out is complete, the rate drops back to the bracket rate.
Sources: Rev. Proc. 2025-32; Publication 915; Instructions for Form 1040; Schedule 1-A (Form 1040); Form 8960 and its instructions; Instructions for Schedule A; Public Law 119-21, sections 70103, 70111 and 70120. An illustration, not tax advice.