Tools › Mechanical Design › Vehicle Dynamics › Vehicle Range Versus Speed › Method
Vehicle Range Versus Speed: Method
Open the Vehicle Range Versus Speed tool
Method: Road Load, Energy per Mile, What It Assumes, Common Mistakes
What the tool does
It works out how far a vehicle goes at a steady speed on the energy in its battery or tank, and how that changes with speed, cold air, wind and grade. The answer comes with a chart of range against speed for your case and a bar showing where the energy goes.
The idea: at a steady speed, energy per mile is a force
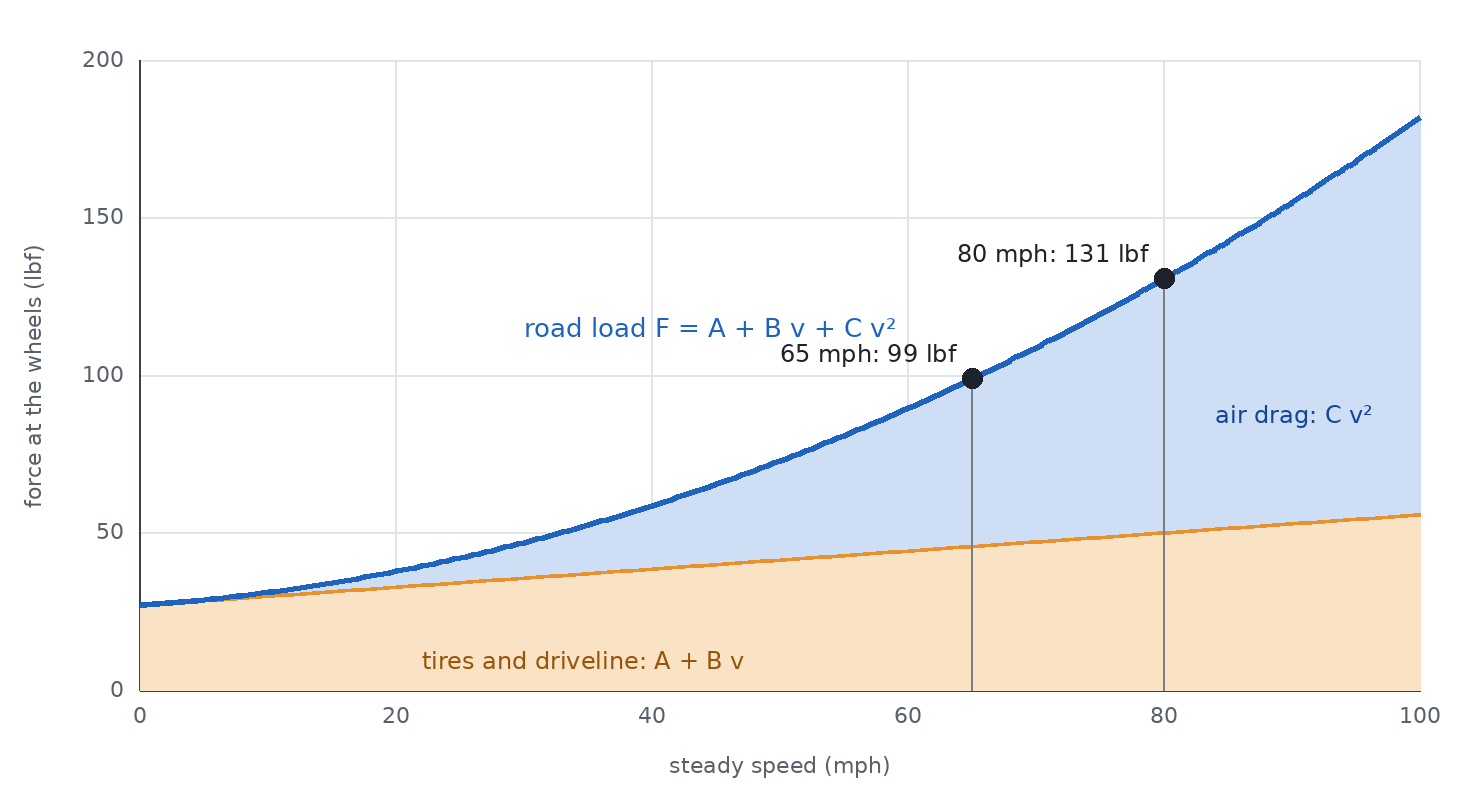
To hold a steady speed the wheels must push with a force equal to everything that holds the vehicle back: the road load. Force times distance is energy, so the road load is the energy needed per unit of distance: 1 newton is 1 joule per meter, and 100 lbf is 199 Wh per mile. Range is the energy on board divided by that. Two parts of the road load behave very differently: tires and driveline drag change little with speed, air drag grows with the square of the speed. That is why range falls faster and faster as you speed up.
The equations
Steady ground speed v, headwind w (a tailwind is negative), road grade G in percent with θ = atan(G / 100), vehicle mass m, weight W = m g.
| Quantity | Coast-down coefficients | Drag coefficient |
|---|---|---|
| Tires and driveline | Ftires = A + B v | Ftires = Crr W cos θ |
| Air drag | Fair = C (ρ / ρtest) (v + w)² | Fair = ½ ρ Cd Af (v + w)² |
| Grade | Fgrade = W sin θ | |
| Road load | F = Ftires + Fair + Fgrade | |
- Air density: ρ = p / (Rair T), with T in kelvin, Rair = 287.05 J/(kg·K), and p the pressure of the U.S. Standard Atmosphere 1976 at the entered elevation (101,325 Pa at sea level).
- Power at the wheels: Pwheels = F v.
- Electric vehicle: Pbattery = Pwheels / η + Paccessories. Going downhill with F negative, the motor charges the battery: Pbattery = Pwheels η + Paccessories.
- Fuel vehicle: Pfuel = (Pwheels + Paccessories) / η, with Pwheels taken as zero when it is negative.
- Energy per distance: e = P / v. Range: R = E / e, with E the usable energy on board. For fuel, E is the volume times the fuel's energy content: 33.7 kWh per U.S. gallon of gasoline (8.90 kWh/L), 37.7 kWh per gallon of diesel (9.95 kWh/L).
- Speed that halves the range: the speed above yours at which R is half its value at your speed, found numerically.
Where the vehicle numbers come from
Before a vehicle is certified in the United States its maker measures how fast it slows down when coasting in neutral on a level road, and fits the retarding force with F = A + B v + C v². The U.S. EPA publishes these "target" coefficients, in lbf, lbf/mph and lbf/mph², with the equivalent test weight, in its Test Car List Data for every model year. The listed vehicles use the model year 2025 file exactly as published. A vehicle may appear in the file in several configurations (wheels, tires, trim); the tool uses one test vehicle per listing and names its coefficients in the results. Battery ratings come from EPA's Fuel Economy Guide data, as pack voltage times amp-hours: a nominal figure, not a measured usable energy. Only electric vehicles whose filed rating is consistent with the energy on their label are listed.
The tool treats the C term as air drag and the A and B terms as tires and driveline. That split is a convention: a coast-down fit does not separate causes, and a little air drag hides in B and a little tire loss in C. The coefficients are corrected by the test procedure to a standard air of 20 °C and 98.21 kPa (density 1.167 kg/m³); the tool scales the C term from that density to yours. The reference pressure is typed from memory of the SAE coast-down procedure and was not read for this page.
For a listed fuel vehicle the efficiency η is derived on this site, not published by EPA: it is the wheel energy the coefficients require over EPA's highway test schedule divided by the fuel energy the vehicle used on that test (its unadjusted highway result in the same file). It is an average over a cycle that averages 48 mph. For electric vehicles η = 0.90 is assumed for motor, inverter and gears; the same comparison with the highway test puts the wall-to-wheel figure between 0.73 and 0.98 depending on how much braking energy is counted as recovered, charging losses included.
What it assumes
- One steady speed, held from full to empty, with no stops, traffic, curves or speed changes.
- A dry road, tires and driveline as they were on the coast-down test, the vehicle at its test weight with nothing on the roof or behind it.
- Wind straight ahead or straight behind. A crosswind also adds drag and is not modeled.
- One efficiency at every speed and load. For a fuel vehicle this is the weakest assumption: an engine is least efficient at light load.
- All of the entered energy can be used, and the battery delivers the same energy cold as warm.
- The air is still inside the cabin: no heating or cooling unless you add it as accessory power or use the cold-day comparison.
When it misleads
- Against the label range. The range on the window label comes from EPA's city and highway test cycles with an adjustment, not from one steady speed. The two answer different questions and should not be expected to agree.
- Against the road. The coefficients are measured on a dry, level track in mild weather, and the derived fuel efficiency comes from laboratory results before EPA's label adjustment. EPA itself lowers those results for the label (for the opening case the guide file lists 183 MPGe unadjusted on the highway test and 128 MPGe on the label), so expect real figures below the tool's.
- At low speed in a fuel vehicle. The constant efficiency makes range rise without limit as speed falls. Real engines waste a larger share at light load, so real fuel economy peaks at a moderate speed and falls off below it.
- In real cold. The cold-day curve counts denser air and a heater. A cold battery also gives up less energy and cold tires roll harder; snow and wet roads add more.
- On a grade. No grade lasts for a whole tank. Read the range on a grade as the rate of use while climbing, and remember that part of the climb comes back on the way down.
- With a trailer, a roof box or a lift kit. The published coefficients are for the vehicle as tested. Enter your own numbers for anything else.
- Battery ratings. Volts times amp-hours as filed is nominal. If you know the usable energy of your car, enter it.
Common mistakes
- Thinking energy use rises in proportion to speed. Air drag force rises with the square of speed and the power to overcome it with the cube. Energy per mile follows the force: the square.
- Adding the headwind to the speed everywhere. A headwind raises the air speed in the drag term only. The tires still turn at ground speed, and the time on the road still depends on ground speed. A 20 mph headwind at 60 mph gives the air drag of 80 mph, not the whole road load of 80 mph.
- Expecting a tailwind to give back what a headwind took. Drag goes with the square, so on an out-and-back trip the headwind leg loses more than the tailwind leg saves.
- Mixing units in the coefficients. EPA's B is in lbf per mph and C in lbf per mph squared. Putting a speed in km/h or m/s into them, or newtons in place of pounds-force, is the usual error. (1 lbf = 4.448 N, 1 mph = 0.447 m/s = 1.609 km/h.)
- Forgetting that force times speed needs consistent units. 1 lbf × 1 mph = 1.989 W; 1 N × 1 km/h = 0.2778 W.
- Using mass where weight belongs. Rolling resistance and grade force use the weight m g in newtons, not the mass in kilograms. In pounds the weight in lbf has the same number as the mass in lb.
- Taking percent grade for degrees. A 6 percent grade is 3.4 degrees. The grade force is the weight times sin(atan(0.06)) = 0.0599 W, very nearly 6 percent of the weight.
- Dividing by efficiency twice, or not at all. The battery or tank must supply the wheel power divided by η. Accessories of an electric vehicle draw from the battery directly and are not divided by the drive efficiency.
- Comparing MPGe with battery energy. EPA's MPGe counts electricity at the wall, charging losses included (33.705 kWh is one gallon). Energy per mile from the battery is lower than the wall figure.
- Reading a steady-speed range as a trip range. A trip has a reserve at the end, speed changes and weather. Treat the steady-speed figure as an upper bound for that speed.
Checks behind this page
The library is checked against closed forms (range equals E η / F without accessories; with air drag alone the range halves at √2 times the speed; a headwind w at speed v gives the drag of v + w), against an independent numpy and scipy computation of 120 seeded cases and the six "Try this" cases, and against Table I of the U.S. Standard Atmosphere 1976 for the air pressure. Every preset value is compared with the EPA files. As a rough check of scale only, the wheel energy the coefficients require over EPA's highway schedule was set beside each vehicle's highway-test result: the implied efficiencies are 0.19 to 0.36 for the fuel vehicles and, wall to wheels, 0.73 to 0.98 for the electric ones, which are plausible figures for engines and electric drives. That agreement says the road loads are of the right size. It does not validate any range. No published steady-speed range test was used.