Tools › Finance and Business › Marketing › Ad Funnel and Budget Planner › Method
Ad Funnel and Budget Planner: Method
Open the Ad Funnel and Budget Planner tool
Ad Funnel and Budget Planner: From Spend to Customers and Back
The tool follows an ad budget through its funnel (impressions, clicks, each stage you name, customers) and prices the result: cost per customer, return on ad spend, net profit, and the gross profit that leaves at each stage. Run the other way, it starts from the customers or revenue wanted and returns the budget and traffic needed. Every default and every "Try this" case is an original illustrative number; no industry benchmark rate is built in, so the rates must be your own. An illustration of the arithmetic, not advice.
The idea: a chain of multiplications
A funnel is a product. Money buys impressions, a share of impressions is clicked, a share of clicks reaches the first stage, and so on to the sale. Because the stages multiply, the order of the rates does not matter to the final count, and a rate that is 10 % better anywhere gives 10 % more customers for the same spend. What differs from stage to stage is how many people are standing there to be lost, and what they would have been worth.
The equations
With the ad budget B, the cost per thousand impressions CPM, the click-through rate CTR, the cost per click CPC and the stage rates r1 … rJ written as fractions:
| Quantity | Formula | Small example |
|---|---|---|
| Impressions (priced per 1,000) | B / CPM × 1,000 | 1,000 / 20 × 1,000 = 50,000 |
| Clicks | impressions × CTR, or B / CPC | 50,000 × 0.02 = 1,000 |
| Cost per click from a CPM | CPM / (1,000 × CTR) | 20 / (1,000 × 0.02) = 1.00 |
| Count at stage j | nj = nj−1 × rj | 1,000 × 0.10 = 100 leads; 100 × 0.20 = 20 sales |
| Customer acquisition cost (CAC) | (B + fixed costs) / customers | 1,000 / 20 = 50.00 |
| Revenue | customers × order value × purchases per customer | 20 × 100 × 1 = 2,000 |
| Gross profit | revenue × gross margin | 2,000 × 0.60 = 1,200 |
| Return on ad spend (ROAS) | revenue / B | 2,000 / 1,000 = 2.00 |
| Break-even ROAS | 1 / gross margin | 1 / 0.60 = 1.67 |
| Net profit | gross profit − B − fixed costs | 1,200 − 1,000 = 200 |
| Payback | CAC / (order value × margin) purchases | 50 / 60 = 0.83 of a purchase |
| Break-even cost per click | order value × purchases × margin × r1 × … × rJ | 60 × 0.02 = 1.20 |
Why break-even ROAS is 1 / margin. A unit of ad spend is recovered when the gross profit it brings equals 1: ROAS × margin = 1. At a 60 % margin revenue must be 1.67 times the ad spend; at a 25 % margin, four times. A campaign can therefore sell a great deal and still lose money: revenue above the ad spend is not enough, gross profit must be.
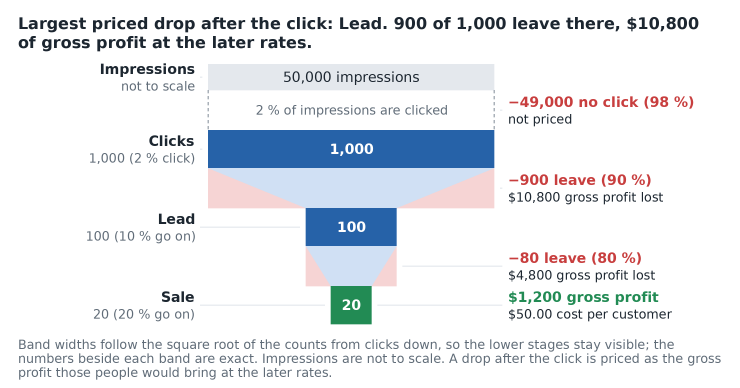
Pricing a drop. The people who leave before stage j number nj−1 − nj. Had they gone on at the later stages' rates, rj+1 × … × rJ of them would have bought, each bringing the gross profit of a customer. That product is the figure written beside each drop in the funnel, and it reduces to gross profit × (1 / rj − 1). In the example the 80 leads that did not buy carry 80 × 60 = 4,800, and the 900 clicks that did not become leads carry 900 × 0.20 × 60 = 10,800. It is an upper mark for what a stage holds back, not a forecast: nobody converts everyone. The impressions that are not clicked are left unpriced, because most impressions are never expected to click.
How the funnel is drawn. A band's width follows the square root of its count, from clicks down: a stage holding 4 % of the clicks is drawn 20 % as wide as the click band. In true proportion the lower stages of most funnels are hairlines; that picture is one select away in Advanced mode (Band Widths: True proportion). The counts, rates and money written beside the bands are exact under either choice, and the impressions strip is never on the scale.
Working backward. For a target of N customers (or revenue / (order value × purchases)), clicks = N / (r1 × … × rJ), impressions = clicks / CTR, and the budget is clicks × cost per click.
One lever at a time. The tool changes one entry, keeps the others and reports customers, cost per customer and net profit. Two facts follow from the multiplication. The same relative gain in any rate lowers the cost per customer by the same amount. The same gain in percentage points is worth most where the rate is lowest: one point on a 4 % rate is a 25 % gain, one point on a 50 % rate is 2 %. More budget, by contrast, buys more of the same: the cost per customer does not move, so profit grows only in proportion and only if the campaign was already ahead.
Rising cost per click (Advanced, an assumption). Buying more of the same audience usually costs more per click. The tool offers one simple shape, cost per click = entered cost × (spend / reference spend)k with 0 ≤ k < 1, so that clicks grow as spend1 − k. Net profit then has a peak, at spend = [K (1 − k)]1 / k with gross profit = K × spend1 − k, and falls to zero at a higher spend. The exponent is your assumption, not a market fact; k = 0 switches it off.
Channel credit (Advanced). When customers meet several channels before buying, a rule must decide who gets the credit. First touch gives the whole customer to the first channel of the path, last touch to the last, the even split gives each touch an equal share. The tool applies all three to the paths you type and shows the spend per credited customer. The total number of customers is the same under each rule; only the split changes.
What it assumes
Every rate is fixed: it does not change with the spend, the audience or the season (unless the rising-cost exponent is used, and then only the cost per click moves). Stages are passed in order, one visit per person. Each customer places the entered number of purchases at the entered order value and margin within the period; nothing is discounted for time and no customer is counted who would have bought anyway. Counts are averages, which is why they carry fractions. Fixed campaign costs count in net profit and in the cost per customer but not in return on ad spend.
When it misleads
When the rates come from a small sample: 4 sales from 16 proposals is a rate of 25 % that could as easily be 10 % or 45 %, and the result of the whole campaign moves with it. When the platform's reported conversions include people who would have bought without the ad, so that the true rates are lower. When a larger budget reaches a colder audience: the rates of a small test rarely hold at ten times the spend. When purchases per customer is a hope and not a measurement. When the margin entered leaves out shipping, payment fees and returns. And when credit rules are read as causes: first touch, last touch and the even split are bookkeeping, and none of them shows what a channel added.
Common mistakes
- Judging a campaign by ROAS above 1. Revenue is not profit: the test is ROAS against 1 / margin.
- Entering a percentage as a fraction or the reverse (0.02 where 2 is meant). The tool takes percentages.
- Multiplying by the wrong base: a stage rate is a share of the stage before it, not of the clicks.
- Mixing a cost per thousand impressions with a cost per click. CPM / (1,000 × CTR) converts one into the other.
- Dividing the ad spend by leads and calling it the cost per customer. Cost per lead and cost per customer differ by the close rate.
- Comparing a cost per customer with the revenue of a customer instead of the gross profit of a customer.
- Counting repeat purchases in revenue but leaving the time they take out of the payback.
- Adding the "gross profit that leaves" of several stages together. Each figure assumes the other stages stay as they are; they are not parts of one total.
For retention and lifetime value from data see Cohort Retention and CLV; for fixed and variable costs and break-even volume see Break-Even and Pricing.