Tools › Finance and Business › Human Resources › Adverse Impact Analysis › Method
Adverse Impact Analysis: Method
Open the Adverse Impact Analysis tool
Adverse Impact Analysis: the Four-Fifths Rule of Thumb and Two Tests
The tool takes, for each group, the number of people considered and the number selected (or laid off), and works out each group's selection rate, its ratio to the highest rate, where that ratio stands against the four-fifths line of the federal Uniform Guidelines on Employee Selection Procedures, and two statistical tests of the difference. It states computed figures and what the regulation says about them. It draws no conclusion about any employer, practice or person, and it is not legal advice.
The idea: compare rates, not counts
A group with fewer applicants will have fewer hires, so counts say little. The Guidelines compare selection rates: the proportion of a group's applicants or candidates who are hired, promoted or otherwise selected (29 CFR 1607.16R). The agencies that issued the Guidelines describe four steps in Question 12 of their Questions and Answers: find each group's rate, find the group with the highest rate, divide each rate by the highest (the impact ratio), and see whether any ratio is under four-fifths, or 80%.
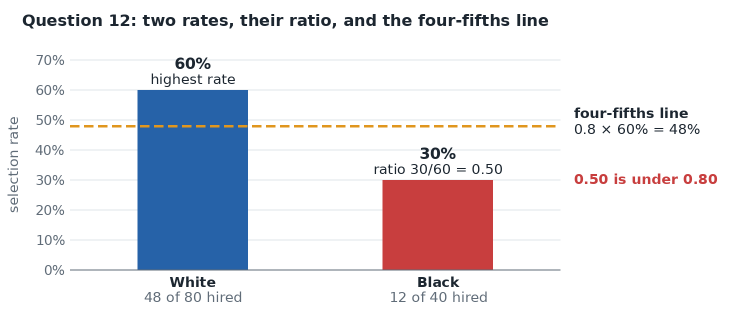
The rule is in 29 CFR 1607.4D: a selection rate under four-fifths of the rate of the group with the highest rate “will generally be regarded by the Federal enforcement agencies as evidence of adverse impact, while a greater than four-fifths rate will generally not be regarded by Federal enforcement agencies as evidence of adverse impact.” The same paragraph then qualifies it in both directions. Smaller differences “may nevertheless constitute adverse impact, where they are significant in both statistical and practical terms”; greater differences “may not constitute adverse impact where the differences are based on small numbers and are not statistically significant.” The agencies call four-fifths a rule of thumb, “not intended as a legal definition, but ... a practical means of keeping the attention of the enforcement agencies on serious discrepancies” (Question 11).
That is why the ratio alone is half an answer. Four hires of 14 against 12 of 30 is a ratio of 0.71, yet one more hire would lift it to 0.89. A pass rate of 53% against 60% among 7,000 test takers is a ratio of 0.88, yet the gap is almost six standard deviations. The tool puts the ratio and the tests side by side so that both readings are visible.
The equations
| Quantity | Formula | Source |
|---|---|---|
| Selection rate of group g | Rg = Xg ÷ Ng (selected ÷ pool) | 29 CFR 1607.16R; Question 12, step 1 |
| Impact ratio | IRg = Rg ÷ Rr, r the group with the highest rate | 29 CFR 1607.4D; Question 12, step 3 |
| Under four-fifths | IRg < 0.8, tested in whole numbers as 5 Xg Nr < 4 Xr Ng | 29 CFR 1607.4D |
| Selections to reach the line | the smallest whole k with (Xg + k) ÷ Ng ≥ 0.8 Rr | arithmetic |
| One person more | the ratio with Xg + 1; the two rates with Xg + 1 and Xr − 1 | Question 21 |
| Standard deviations | Z = (Rg − Rr) ÷ √[ P (1 − P) (1/Ng + 1/Nr) ], P = (Xg + Xr) ÷ (Ng + Nr) | two-sample form of the binomial standard deviation of Castaneda, n. 17 |
| Fisher's exact test | P(k) = C(S, k) C(N − S, Ng − k) ÷ C(N, Ng); p = sum of P(k) over the counts no more likely than the observed one | Fisher (1935) |
Standard deviations. If both groups were selected at one common rate P, the difference between their two observed rates would scatter around zero with the standard deviation in the table. Z is the observed difference measured in those units. The U.S. Supreme Court described the idea for a count compared with its expected value: “if the difference between the expected value and the observed number is greater than two or three standard deviations,” the hypothesis of a random draw would be suspect (Castaneda v. Partida, 430 U.S. 482, 496–497 n. 17, repeated in Hazelwood School District v. United States, 433 U.S. 299, 308–309 n. 14). Those cases compared one count with a population share; with applicant counts for two groups the same measure is taken on the difference of two rates, which is the form used here. Two standard deviations corresponds to a two-sided probability of about .05 and three to about .003.
Fisher's exact test. The normal curve behind Z is an approximation that is poor when counts are small, which is exactly when the question matters most. Fisher's test needs no approximation. Take the people compared (N), the number selected among them (S) and the size of the group (Ng) as fixed. If the S places went to people without regard to group, the number landing in the group follows the hypergeometric distribution in the table. The one-sided p is the chance of the observed count or a more extreme one in the same direction; the two-sided p adds every count, in either direction, that is no more likely than the observed one. The tool draws that distribution with the observed count marked.
Adverse outcomes (layoffs, rejections). When the count entered is the number laid off or rejected, the tool takes the pool less that count as the favorable outcome and forms the four-fifths ratio on those rates. Question 20 of the Questions and Answers does the same with a rule that disqualifies 10% of one group and 4% of another: the selection rates are 90% and 96%, a ratio of about 94%, while the first group is two and a half times as likely to be disqualified. The tool prints both ratios. The two tests give the same answer whichever way the outcome is counted.
Pairwise or pooled. By default each group is tested against the reference group alone. In Advanced mode each group can instead be tested against all other groups pooled together. The impact ratio is taken against the reference group either way.
What it assumes
- The pools and counts are the right ones. Question 15 of the Questions and Answers explains who is an applicant or candidate, and that a person who withdraws is no longer one. The tool takes the numbers as entered.
- Each person is one independent decision, and within the comparison every person had the same chance under the hypothesis tested. Qualifications, job, location and date are not modeled.
- One table is one selection process for one job or job group over one period. Question 13 says the rule is applied first to the overall selection process and then, in some circumstances, to its components.
- The reference group is the one with the highest rate unless you choose row 1.
When it misleads
- Small numbers. A ratio built on a handful of selections moves a great deal with one person. Question 21 gives 3 of 20 against 16 of 80 (a ratio of 75%): one different selection would make the first group's rate the higher one. The “one person more” lines of the tool show this test for your numbers.
- Large numbers. With thousands of people almost any difference is statistically significant. Section 4D asks for significance in “both statistical and practical terms”; a tiny p-value says the difference is unlikely to be chance, not that it is large.
- Pooling unlike things. Adding several jobs, sites or years into one table can create a difference that no single job shows, or hide one that every job shows (Simpson's paradox). The tool has no stratified test.
- Many comparisons. With several groups, some comparison can pass a .05 level by chance. The tool does not adjust for the number of comparisons.
- The ratio depends on which outcome is counted. Retention rates of 78% and 90% give 0.87; the layoff rates behind them, 22% and 10%, differ by a factor of 2.2.
- An atypical pool. Section 4D notes that recruiting or other programs can make a group's applicant pool atypical, and that discouraged applicants do not appear in the counts at all.
Common mistakes
- Dividing counts instead of rates: 12 hires against 48 hires is not a ratio of 0.25 when the pools are 40 and 80; the rates are 30% and 60%, and the ratio is 0.50.
- Subtracting instead of dividing: 60% − 30% = 30 points is not the test; the rule divides, 30 ÷ 60.
- Using the largest group, or the group you expect, as the reference. The regulation names the group with the highest rate.
- Reading “less than four-fifths” as “four-fifths or less”: 48% against 60% is exactly 80% and is not under the line (Question 11's own example).
- Treating the ratio as the answer when the numbers are small, or ignoring a significant difference because the ratio is above 0.8.
- Reading a p-value as the probability that the result is due to chance. It is the probability of a difference at least this large if group played no part.
- Counting people who withdrew as applicants not selected.
What the tool does not do
It does not decide who is an applicant, whether a procedure is job related or validated, or any legal question. It has no test for several strata, no comparison of a workforce with a labor market (the one-sample form of the Castaneda and Hazelwood footnotes), and no correction for multiple comparisons. It covers the rule of thumb of the federal Uniform Guidelines only. These are computed figures, not legal advice.