Tools › Finance and Business › Auditing › Benford's Law Test › Method
Benford's Law Test: Method
Open the Benford's Law Test tool
Benford's Law Test: First Digit, Second Digit and First Two Digits
The tool takes a list of amounts and compares their leading digits with Benford's law in three ways (first digit, second digit, first two digits), then lists the most repeated amounts, the share of round amounts and the amounts just under a limit you enter. It reports counts, proportions and test statistics and says whether the data set suits the test at all. A deviation from Benford's law is a reason to look at those entries, not evidence of fraud or error.
The idea: amounts spread evenly on a logarithmic scale
In many lists of amounts that arise from transactions or from nature, the first digit is 1 about 30 % of the time and 9 under 5 % of the time. Newcomb (1881) stated the rule behind this: the fractional parts of the logarithms of such numbers are equally likely. Benford (1938) found it again in twenty tables of data, and the law carries his name. Hill (1995) showed why it turns up so often: when data are drawn from many different distributions, the leading digits of the combined sample tend to the logarithmic law.
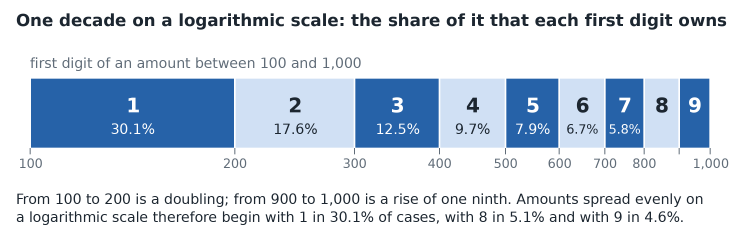
An amount that grows by a steady percentage spends a long time between 100 and 200 (it has to double) and a short time between 900 and 1,000 (it needs one ninth more). A list that mixes small, medium and large amounts over several orders of magnitude behaves the same way, and the law does not change when every amount is multiplied by a constant, so it holds in any currency.
The equations
| Quantity | Formula | Note |
|---|---|---|
| First digit d = 1 to 9 | p = log10(1 + 1/d) | 0.3010, 0.1761, 0.1249, 0.0969, 0.0792, 0.0669, 0.0580, 0.0512, 0.0458 |
| First two digits d = 10 to 99 | p = log10(1 + 1/d) | from 0.0414 for 10 down to 0.0044 for 99 |
| Second digit d = 0 to 9 | p = sum over k = 1 to 9 of log10(1 + 1/(10k + d)) | from 0.1197 for 0 down to 0.0850 for 9: much flatter than the first digit |
| Expected count | E = n p | n = number of amounts tested |
| Chi-square | X² = sum of (O − E)² ÷ E over the K digits | K − 1 degrees of freedom: 8, 9 and 89 |
| Mean absolute deviation | MAD = sum of |O/n − p| ÷ K | does not grow or shrink with n |
| z-statistic of one digit | z = (|O/n − p| − 1/(2n)) ÷ √(p (1 − p)/n) | the term 1/(2n) is used only when it is smaller than the gap |
Which digits. The digits of an amount are its first significant digits wherever the decimal point is: 0.0314 has first digit 3 and second digit 1, and 5 has second digit 0. Zero has no leading digit and is left out. Negative amounts are tested by their absolute value or left out, as you choose.
Three tests, three questions. The first-digit test is coarse: nine categories, so it needs little data and sees only large distortions. The first-two-digits test has ninety categories; it points at particular amounts (48 and 49 when entries bunch under 5,000), but every expected count reaches 5 only from about 1,150 amounts. The second-digit test looks at rounding: an excess of 0 and 5 is the mark of estimated or quoted amounts. The digits are not independent of each other (Hill, 1995), so the three tests overlap.
One digit at a time, and how many to expect. Each digit's z-statistic is compared with the two-sided critical value of the significance level you choose (1.960 at 5 %). At that level one digit in twenty lies beyond the critical value by chance alone, so about 4.5 of the 90 first-two-digit pairs do in data that follow the law exactly. The page prints that expected number beside the number found. Lesperance and others (2016) make the same point about reading many single-digit intervals at once.
Mean absolute deviation. Chi-square grows with the number of amounts: with tens of thousands of amounts even a trivial departure gives a tiny p-value. The mean absolute deviation is the average gap between observed and Benford shares and does not depend on the count, which is why it is reported beside chi-square. Nigrini (2012) publishes reference ranges for it; they are in a copyrighted book and are not reproduced here. You can enter a reference value of your own in Advanced mode, and the page states only whether the computed value is above or below it.
Repeated amounts, round amounts, amounts under a limit. These three counts need no law. Amounts are compared to the cent. The round-amount table sets the shares found beside the shares that evenly spread ending digits would give. For a limit T and a band b, the page counts the amounts from T(1 − b) up to T and from T up to T(1 + b) and draws the amounts around T in steps.
When Benford's law is an expectation, and when it is not
- It fits amounts that spread over several orders of magnitude and arise from multiplying or mixing many quantities: invoice and payment amounts of a whole business, populations, tax figures. A lognormal distribution comes arbitrarily close to the law as its spread increases (Lesperance and others, 2016).
- It does not fit uniformly distributed random numbers, telephone numbers, dates, or data drawn from a normal or an exponential distribution (Hill, 1995; Lesperance and others, 2016). The same goes for assigned numbers (invoice numbers, account codes, zip codes), amounts with a built-in minimum or maximum, prices set at one level, and any list confined to a narrow range.
- The page's screen. The page measures how many orders of magnitude the middle 90 % of the amounts cover. Under one, it says the law is not an expectation; between one and two, that it is an approximation; and it says when the count is too small for every expected count to reach 5. These limits are this page's own screen, chosen because an amount needs a factor of ten to run through every first digit once. They are not taken from a standard.
What it assumes
- Every line is one amount of the same kind (one ledger, one account, one expense type) and the list is complete for the period looked at.
- The amounts are transaction amounts, not assigned numbers, and nothing in the process fixes their first digits.
- Each amount counts once. Splitting or netting entries before the test changes the digits.
- The chi-square p-value and the z-statistics use large-sample approximations; with few amounts they are rough.
When it misleads
- Ordinary causes of a spike. A monthly fee of 49.00, a contract price of 4,850, a per-diem rate or a standing order puts hundreds of entries on one pair of digits. The spike is real and has nothing to do with wrongdoing. The repeated-amounts table usually shows the cause.
- Mixed populations. Payroll, rent and petty cash in one list give a pattern that belongs to none of them. Test like with like.
- Very large lists. With many thousands of amounts chi-square rejects almost any real data set; read the mean absolute deviation and the size of the gaps.
- Small lists. With a few hundred amounts the first-two-digits test has expected counts of 1 or 2 and its single pairs swing by chance.
- Agreement proves little. Entries that follow the law can still be wrong, and a person who knows the law can produce amounts that follow it.
- A limit that is also a price point. Amounts under 5,000 can cluster because suppliers price under round figures. A count under a limit tells where the entries are, not why.
Common mistakes
- Running the test on data that cannot follow the law (a narrow range, assigned numbers, capped amounts) and reading the result as a finding.
- Treating every digit beyond the critical value as a signal, without counting how many lie beyond it by chance.
- Reading a small p-value as proof of manipulation, or a large one as a clean bill of health.
- Taking the first digit of 0.52 as 0: the first significant digit is 5.
- Using log10(1 + 1/d) with d = 0 to 9 for the second digit. The second digit needs the sum over the nine first digits.
- Testing the first two digits with a few hundred amounts.
- Comparing the mean absolute deviation of a first-digit test with a reference value meant for the first two digits; the three tests have different scales.
To draw a sample of the entries for detailed testing and project what is found, see the Audit Sampling tool; it reads the same pasted rows (id, book amount, stratum), and this page lets you name the amount column of such rows.
The tool's test reproduces the first-digit counts, the Benford proportions and the Pearson chi-square p-value of 0.018 printed for 121 genome counts by Lesperance and others (2016, Tables 5 and 6), and checks every count, statistic and p-value of its own cases against an independent numpy and scipy computation.