Tools › Finance and Business › Accounting › Income Statement Flow › Method
Income Statement Flow: Method
Open the Income Statement Flow tool
Income Statement Flow: Where the Revenue Goes
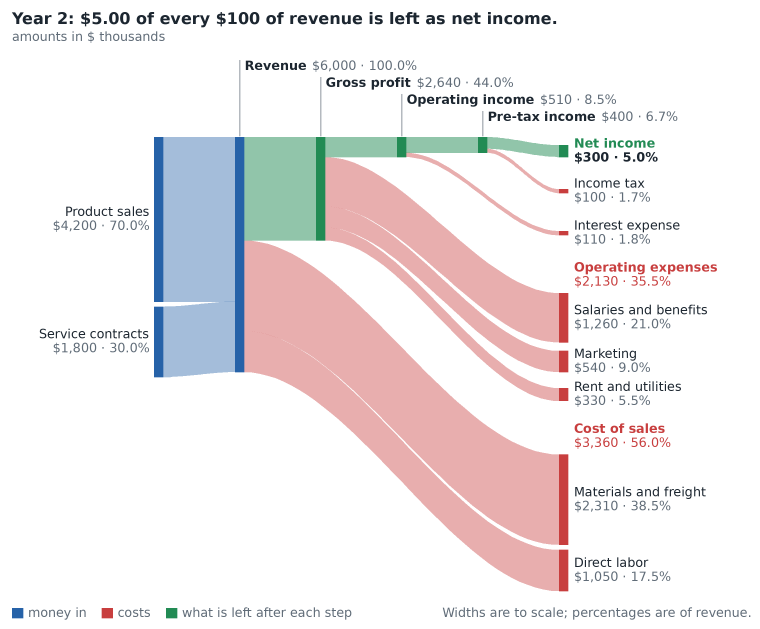
The tool reads the lines of an income statement, each with a name, an amount and a kind, and works out the subtotals (gross profit, operating income, pre-tax income, net income) and each of them as a share of revenue. It then draws the statement as a money-flow diagram in which the width of every ribbon is the amount it carries, so the picture shows at a glance which costs take most of the revenue and how much is left. The tool computes and describes; it is not accounting or investment advice.
The idea: a set of stairs
The U.S. Securities and Exchange Commission's guide for beginners describes an income statement as a set of stairs. At the top is the money brought in from sales. Each step down takes away one group of costs: first the cost of what was sold, then the expenses of running the business, then interest and income tax. At the bottom is what the company earned or lost, the "bottom line". The diagram draws those stairs sideways. Revenue enters at the left; at each step a red ribbon peels off for the costs of that step and a green ribbon carries the rest to the next step.
The subtotals and the margins
Each line is given one of seven kinds. Lines of one kind are added up:
gross profit = revenue − cost of sales
operating income = gross profit − operating expenses
pre-tax income = operating income + other income − interest expense − other expenses
net income = pre-tax income − income tax
A margin is a subtotal divided by revenue, written as a percentage:
gross margin = gross profit / revenue × 100, and the same for the operating, pre-tax and net margin
The common-size statement does this for every line: each amount is divided by revenue. Two statements of different size, two years of one firm or two firms, can then be read side by side. The change between two columns is given twice: in money, and in percentage points, which is the difference of the two shares. A gross margin of 44.0% against 48.0% is a change of −4.0 points (not of −4%).
Amounts are entered as positive numbers; the kind says whether the line adds to profit or takes from it. Four kinds may be negative, and a negative amount changes side: a negative income tax is a tax benefit, a negative interest expense is net interest income, a negative other expense is a gain, and a negative other income is a cost.
How the diagram is built
Every stage that has at least one line becomes a node on the trunk. What enters a node equals what leaves it:
subtotal entering the stage + money from inflows = costs of the stage + subtotal leaving the stage
In a profitable statement without other income there are no inflows, and every node simply splits into its costs and the rest. Other income, and a tax benefit, are inflows: they are drawn in blue above the trunk and join it at their stage, so the trunk becomes wider there.
A loss. When the costs of a stage are larger than what arrives, the trunk ends there: a ribbon cannot have a negative width. The costs still have to be paid for, so the money that is missing is drawn as an inflow too. Other income and a tax benefit are used first, on the earliest shortfall; what they do not cover is the net loss, drawn in red. The net loss in the diagram is therefore exactly the net loss of the statement, and every cost ribbon keeps its true width. Which inflow covers which shortfall is a drawing choice (money is not marked); the subtotals do not depend on it.
Cost lines end in one column at the right, each with its name, its amount and its share of revenue. When one kind has more lines than the number shown per kind (six unless changed in Advanced mode), the largest are drawn and the rest are added into one ribbon named Other. The table lists every line.
With a second column the tool draws both statements at one scale, so a ribbon of the same width is the same amount of money in both figures, and a bar chart of the shares of revenue.
What it assumes
- The kind given to each line is right. The tool cannot tell a cost of sales from an operating expense; the subtotals follow the kinds as entered.
- The statement has the common multi-step layout: cost of sales, operating expenses, interest and other items, income tax. Items that some statements show elsewhere (discontinued operations, the share of profit that belongs to minority owners, preferred dividends) have no kind of their own.
- All amounts are in one currency and one unit (all in thousands, or all in millions).
- Revenue is net of returns and discounts. A revenue line cannot be negative.
When it misleads
- Profit is not cash. An income statement counts a sale when it is made and a cost when it is incurred, and it spreads the cost of equipment over years as depreciation. A firm can show net income and still run short of cash. The 13-Week Cash Flow tool works with cash.
- Margins differ by line of business. A grocery chain and a software firm with the same revenue have very different statements for reasons that have nothing to do with how well either is run. A margin means little without knowing the trade.
- One period is one period. A single large item (a gain on a sale, a write-off) can move net income in a year without saying anything about the next.
- Classification moves margins. Two firms may put the same cost (delivery, depreciation of a plant) in different groups. Their gross margins then differ while their operating margins do not.
- The statement says nothing about the balance sheet. Debt, liquidity and return on capital need the other statements; see Financial Ratios.
Common mistakes
- Entering a subtotal as a line. Gross profit, operating income and total operating expenses are computed; if one is typed in as a line it is counted twice.
- Entering costs as negative numbers. The kind carries the sign; every cost is a positive amount.
- Mixing units: revenue in millions and one expense in thousands.
- Calling a change in a margin a percentage. From 12% to 5% is a fall of 7 percentage points; it is a fall of 58% of the earlier margin.
- Dividing by the wrong base. Every share in a common-size statement is a share of revenue, not of total costs and not of the line above.
- Putting depreciation in twice: once inside cost of sales or an expense line, and once more as a line of its own.
- Reading the tax line as a rate on revenue. Income tax is levied on pre-tax income; as a share of revenue it is small even when the tax rate is not.