Tools › Structures › Fatigue › Notch Sensitivity › Method
Notch Sensitivity: Method
Open the Notch Sensitivity tool
Notch Sensitivity and Fatigue Notch Factor
Problem Statement
A member with a notch, hole or fillet of root radius r has an elastic stress concentration factor Kt. Fatigue tests show that the fatigue limit of the notched member is reduced by a smaller factor, the fatigue notch factor Kf = (fatigue limit of the smooth specimen)/(fatigue limit of the notched specimen on its net section), with 1 ≤ Kf ≤ Kt. The notch sensitivity q = (Kf − 1)/(Kt − 1) measures how much of the elastic concentration the material feels: q = 1 is full sensitivity, q = 0 none. Two things set it: the root radius, because the material responds to the stress averaged over a small volume at the root and a sharp notch has a steep gradient, and the strength of the material, because strong materials have a smaller averaging volume. Small notches are the practical point: a scratch, a small hole or a sharp fillet in a ductile material has a Kf far below its Kt, and below some depth a notch does not reduce the fatigue limit at all.
The tool takes Kt, the root radius r, the flank angle ω of a V-notch (0 for round notches, holes and fillets), the material and its ultimate tensile strength Ftu (written Sult in the NACA reports and Sut in Shigley), and optionally the notch depth d, the fatigue limit Se and the threshold stress intensity range ΔKth. It returns q and Kf by the two forms below, the constants they used with their derivation, and the recommended Kf.
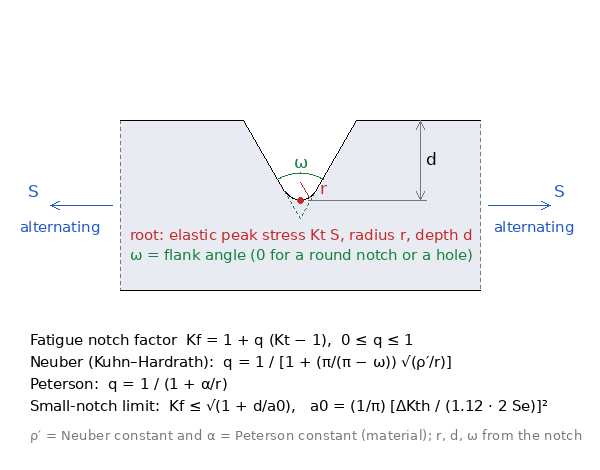
Figure A: A notch of root radius r, depth d and flank angle ω under an alternating nominal stress S. Kt is the elastic peak at the root; Kf is the factor on the fatigue limit. ρ′ and α are the material constants of the two forms.
Key Assumptions
Long-life, fully reversed loading; wrought steels, aluminum and titanium alloys; constants tied to the ultimate strength. The relations are empirical fits to rotating-beam and axial fatigue tests with a scatter of roughly 20 % in q. They give the factor on the fatigue limit (106 to 107 cycles); at shorter lives the effective factor falls toward 1. They do not transfer to castings, polymers or composites without test data, and they assume the notch root stays elastic in the sense of the fatigue-limit test.
Neuber's Form
Neuber proposed that the material responds to the stress averaged over an elementary block of size ρ′ at the root. Kuhn and Hardrath (NACA TN 2805, 1952) wrote the resulting factor for a V-notch of flank angle ω as
q = 1 / [1 + (π/(π − ω)) √(ρ′/r)], Kf = 1 + q(Kt − 1),
which for a round root (ω = 0) is the familiar q = 1/(1 + √(ρ′/r)). The Neuber constant ρ′ is a length (Neuber's and Pilkey's symbol; Kuhn and Hardrath write A, Dowling β, Shigley tabulates its square root as √a). It falls steeply with strength: a weak alloy is nearly insensitive to a sharp notch, a strong one is not.
Peterson's Form
Peterson (1959) proposed the simpler hyperbola
q = 1 / (1 + α/r), Kf = 1 + q(Kt − 1),
with the Peterson constant α, also a length (Peterson wrote it a; Dowling and Pilkey write α, used here to keep it apart from Shigley's √a). Peterson's constants are given for bending and axial loads. The two forms agree within their scatter over the usual range of radii; the Neuber form rises more steeply from q = 0 at very small radii because of the square root.
Material Constants
The tool evaluates the constants from the material choice and Ftu and prints the working on the results page; a constant typed on the form is used instead, as entered.
Steels. ρ′ for bending and axial loads is read from Kuhn and Hardrath's own curve, Figure 3 of NACA TN 2805, digitized for the tool and interpolated linearly between the points of Table 1 (50 to 250 ksi; outside that range the nearer end is used, with a note). For torsion, for which the NACA report has no curve, the tool uses Shigley's torsional fit (eq. 6-35b): √ρ′ = 0.190 − 2.51(10−3)Ftu + 1.35(10−5)Ftu² − 2.67(10−8)Ftu³ √in with Ftu in ksi, 50 to 250 ksi; the torsional constant is smaller, so a notch is felt more in torsion. α comes from Dowling's fit to Peterson's steel data, log10 α = 2.654(10−7)Ftu² − 1.309(10−3)Ftu + 0.01103 with α in mm and Ftu in MPa, 345 to 2070 MPa (0.27 mm at 500 MPa, 0.093 mm at 1000 MPa, 0.027 mm at 2070 MPa), which spans Peterson's own values of 0.01 in for annealed or normalized steels and 0.0025 in for quenched and tempered steels.
| Ftu (ksi) | 50 | 60 | 70 | 80 | 90 | 100 | 120 | 140 | 160 | 180 | 200 | 220 | 250 |
|---|---|---|---|---|---|---|---|---|---|---|---|---|---|
| √ρ′ | 0.126 | 0.106 | 0.093 | 0.082 | 0.073 | 0.064 | 0.051 | 0.040 | 0.031 | 0.023 | 0.017 | 0.011 | 0.0055 |
Aluminum alloys. ρ′ comes from the curves Kuhn and Figge fitted to notch fatigue and static notch tests of wrought sheet (NASA TN D-1259), as reproduced in Kuhn's 1965 Figure 2(b) and digitized for the tool (Table 2). Heat-treated T tempers and annealed or strain-hardened O and H conditions have separate curves, the second lower, so they are separate choices in the Material list; the curves cover 13 to 90 ksi (T) and 12 to 46 ksi (O, H). α is Peterson's single value for aluminum alloys, 0.02 in (0.51 mm).
| Ftu (ksi) | 13 | 15 | 20 | 25 | 30 | 40 | 46 | 50 | 60 | 70 | 80 | 90 |
|---|---|---|---|---|---|---|---|---|---|---|---|---|
| T condition | 0.508 | 0.467 | 0.370 | 0.311 | 0.269 | 0.214 | 0.19 | 0.179 | 0.159 | 0.143 | 0.130 | 0.119 |
| O and H condition | 0.404 | 0.344 | 0.256 | 0.200 | 0.164 | 0.123 | 0.100 |
Titanium alloys. No published constant exists. The tool offers α = 0.0015 in (0.038 mm), back-calculated with α = r(1/q − 1) from the only systematic notch-radius series found in the open literature, Mowbray's KAPL-3158 tests of annealed Ti-6Al-6V-2Sn (Ftu 159 ksi) at 106 cycles and room temperature (Table 3); the report itself rates the alloy's sensitivity as that of a 200 ksi steel. Other titanium data disagree strongly: Hosseini's rotating-bending tests of Ti-6Al-4V at Kt = 3.6 and r = 0.144 mm gave q of only 0.015 to 0.05, which would mean α of several millimetres. The titanium value is therefore the conservative end of a wide range. No Neuber constant is offered for titanium (Kuhn's 1965 Figure 2(c) gives tentative ones, marked for static notch factors only); enter ρ′ if a value is known.
| r (in) | Kt | Kf | q | α = r(1/q − 1) |
|---|---|---|---|---|
| 0.001 | 6.9 | 3.3 | 0.39 | 0.0016 in |
| 0.0015 | 10.0 | 6.1 | 0.57 | 0.0011 in |
| 0.005 | 5.7 | 4.5 | 0.74 | 0.0018 in |
| 0.015 | 3.4 | 2.6 | 0.67 | 0.0074 in (not used) |
Other materials, or a measured value. Enter the constants. Either one is back-calculated from a single notched fatigue test of the material: with the smooth and notched fatigue limits you have Kf, and for the specimen's Kt and root radius α = r(Kt − Kf)/(Kf − 1) and ρ′ = r[(Kt − Kf)/(Kf − 1)]². MIL-HDBK-5J carries notched fatigue curves (Kt = 2 and 3 specimens) for many alloys from which this can be done.
Threshold Bound for Small Notches
Neither form says when a notch stops mattering altogether. Smith and Miller (1978) showed that beyond a critical acuity a notch behaves like a crack of its own depth d: the fatigue limit of the member is the stress range at which such a crack reaches the threshold, Δσ = ΔKth/(Y√(πd)), whatever Kt is. El Haddad, Topper and Smith (1979) joined this to the smooth fatigue limit Δσe with the intrinsic crack length a0 = (1/π)(ΔKth/(YΔσe))², so that Δσ = ΔKth/(Y√(π(d + a0))) holds for every depth (the Kitagawa–Takahashi diagram). The fatigue notch factor can therefore never exceed
Kf,th = Δσe/Δσ = √(1 + d/a0).
The tool evaluates it with Y = 1.12 (edge crack), Δσe = 2Se and the long-crack threshold at R = −1, when the fatigue limit, the threshold and the notch depth are entered, and caps the fatigue notch factor by it. For a steel with Se = 50 ksi and ΔKth = 6 ksi√in, a0 = 0.0009 in: a notch 0.002 in deep cannot cost more than a factor of 1.8 however sharp it is, and one 0.0005 in deep less than 1.25.
What the Tool Reports
The constants with their derivation (the curve points or fit with the numbers substituted, or "entered"), q and Kf by each form, the threshold bound, and a recommended Kf: the higher of the two forms (conservative), capped by the bound when it applies. Two charts show q and Kf against the root radius with the user's notch marked.
Checks
For r → ∞ both forms give q = 1 and Kf = Kt; for r → 0 they give q = 0 and Kf = 1. The digitized curves sit on the figures (overlays filed with the sources). For a 0.1 in radius in a 100 ksi steel in bending the tool gives q = 0.84 by Neuber (√ρ′ = 0.064 √in) and 0.94 by Peterson (α = 0.0068 in), matching the published notch-sensitivity charts.
Limitations
The constants are statistical fits to test data on wrought alloys and carry about 20 % scatter; the titanium value rests on one alloy and is conservative. The relations describe the fatigue limit under fully reversed loading; mean stresses, finite life, surface finish, size and residual stresses are separate factors. Peterson's form is not evaluated in torsion unless a constant is entered. The threshold bound uses a long-crack ΔKth at R = −1 and the edge-crack geometry factor; thresholds at other stress ratios or for short cracks differ, and the bound is a limit, not a prediction.